Audit Methodology

The Commission has been implementing a risk-based audit in the conduct of its audit services.
However, to meet the evolving developments in public governance and fund management, the
results-based approach in the audit was incorporated.

Scope of Audit

An audit was conducted on the accounts and operations of the Municipal Government of
Vallehermoso for 2024. The audit consisted of a review of operating procedures, evaluation of
the LGU’s programs and projects, interview of concerned government officials and employees,
verification, reconciliation, confirmation, inspection, and analysis of accounts, and such other
procedures considered necessary.

Financial Highlights

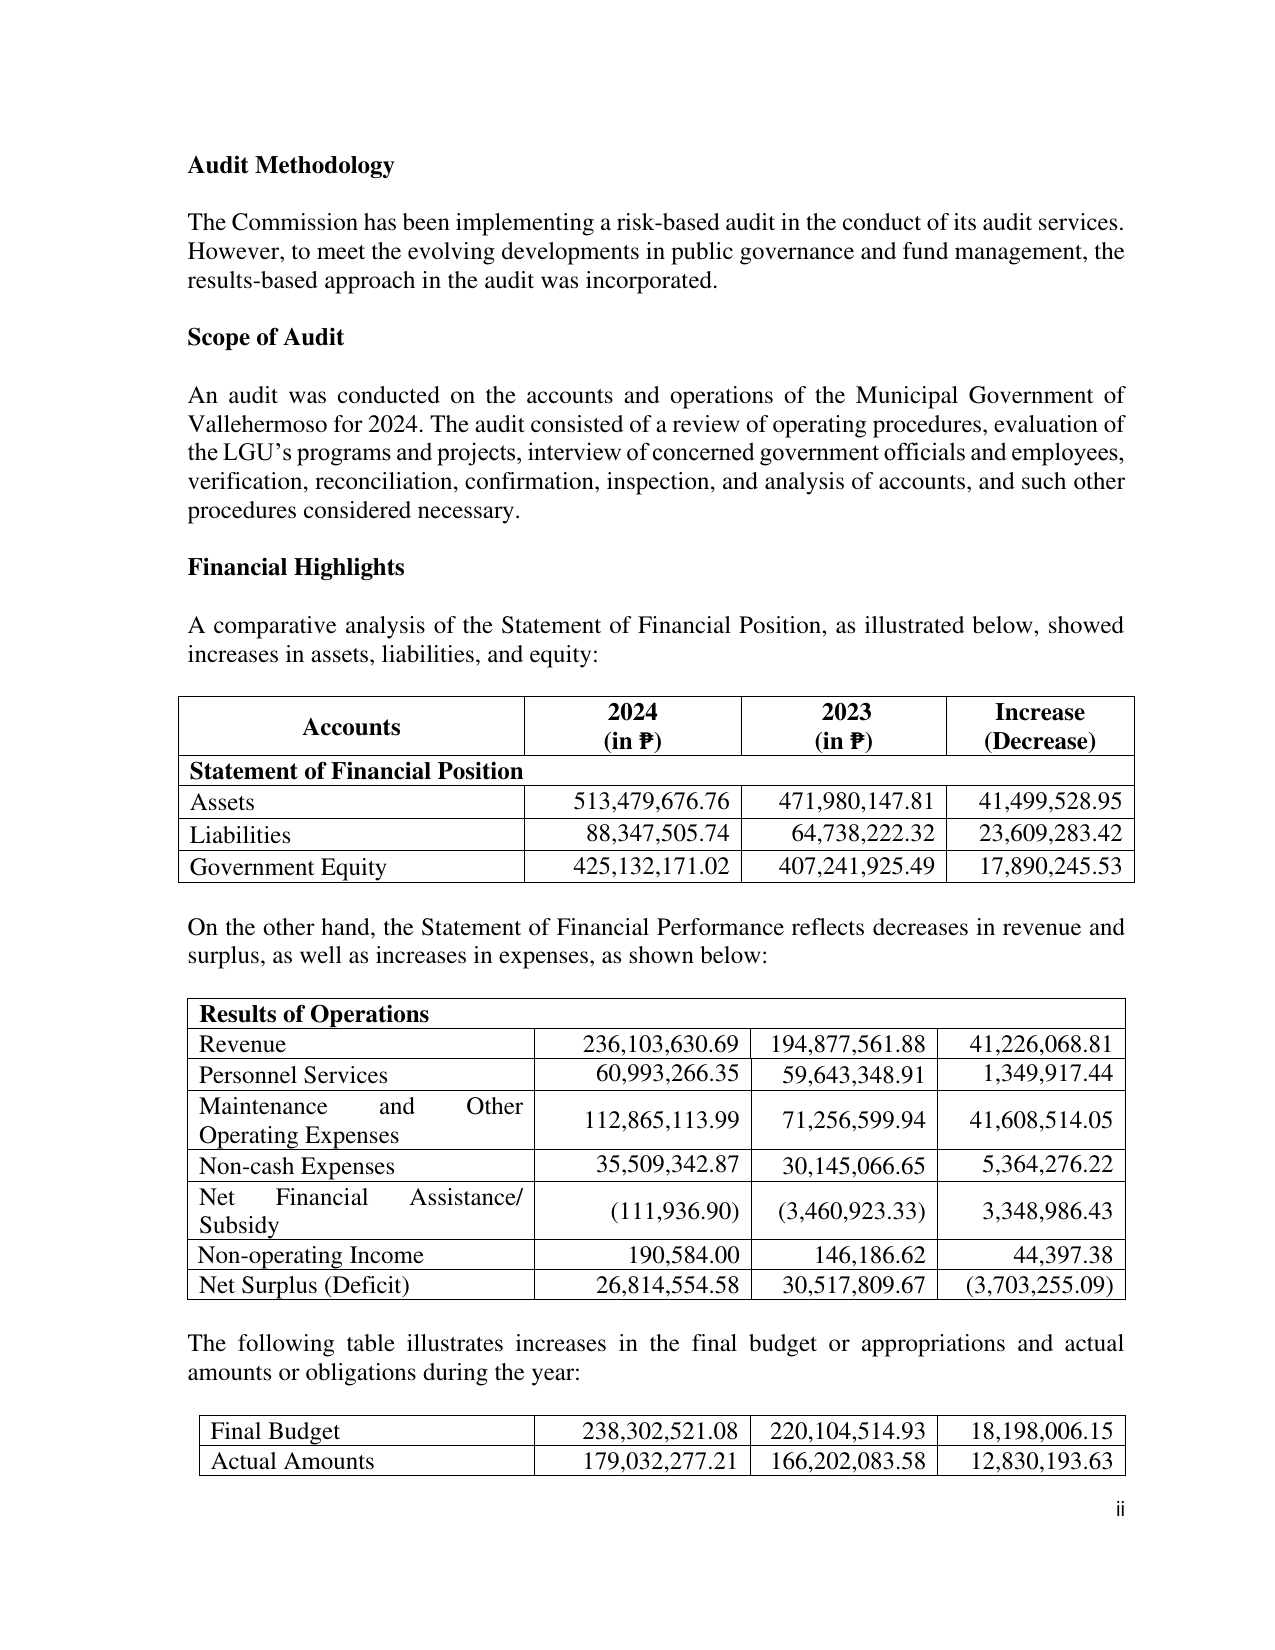
A comparative analysis of the Statement of Financial Position, as illustrated below, showed
increases in assets, liabilities, and equity:

                                           2024                  2023             Increase
           Accounts
                                          (in ₱)                (in ₱)           (Decrease)
Statement of Financial Position
Assets                                 513,479,676.76       471,980,147.81       41,499,528.95
Liabilities                             88,347,505.74        64,738,222.32       23,609,283.42
Government Equity                      425,132,171.02       407,241,925.49       17,890,245.53

On the other hand, the Statement of Financial Performance reflects decreases in revenue and
surplus, as well as increases in expenses, as shown below:

 Results of Operations
 Revenue                                236,103,630.69     194,877,561.88       41,226,068.81
 Personnel Services                      60,993,266.35      59,643,348.91        1,349,917.44
 Maintenance      and      Other
                                        112,865,113.99      71,256,599.94       41,608,514.05
 Operating Expenses
 Non-cash Expenses                       35,509,342.87      30,145,066.65        5,364,276.22
 Net    Financial     Assistance/
                                           (111,936.90)     (3,460,923.33)       3,348,986.43
 Subsidy
 Non-operating Income                       190,584.00         146,186.62           44,397.38
 Net Surplus (Deficit)                   26,814,554.58      30,517,809.67      (3,703,255.09)

The following table illustrates increases in the final budget or appropriations and actual
amounts or obligations during the year:

  Final Budget                          238,302,521.08     220,104,514.93       18,198,006.15
  Actual Amounts                        179,032,277.21     166,202,083.58       12,830,193.63
                                                                                                ii