18.4 The City Treasurer or his/her deputy shall then prepare the certified list of all RPT
     delinquencies which remained uncollected for at least one year, with the
     corresponding justifications for non-collection or non-payment. This list, along
     with the justification, shall then be submitted to the Sanggunian concerned on or
     before December 31 of the year immediately succeeding the year in which the
     delinquencies were incurred, with a request for assistance in the enforcement of
     remedies.

18.5 On the other hand, Chapter 1, Section 1 part C.1 (d) of the Manual on Real Property
     Appraisal and Assessment Operations emphasizes one of the major functions of
     the Local Assessors, which is to make frequent physical surveys to check and
     determine whether all real properties within the locality are properly listed in the
     assessment rolls.


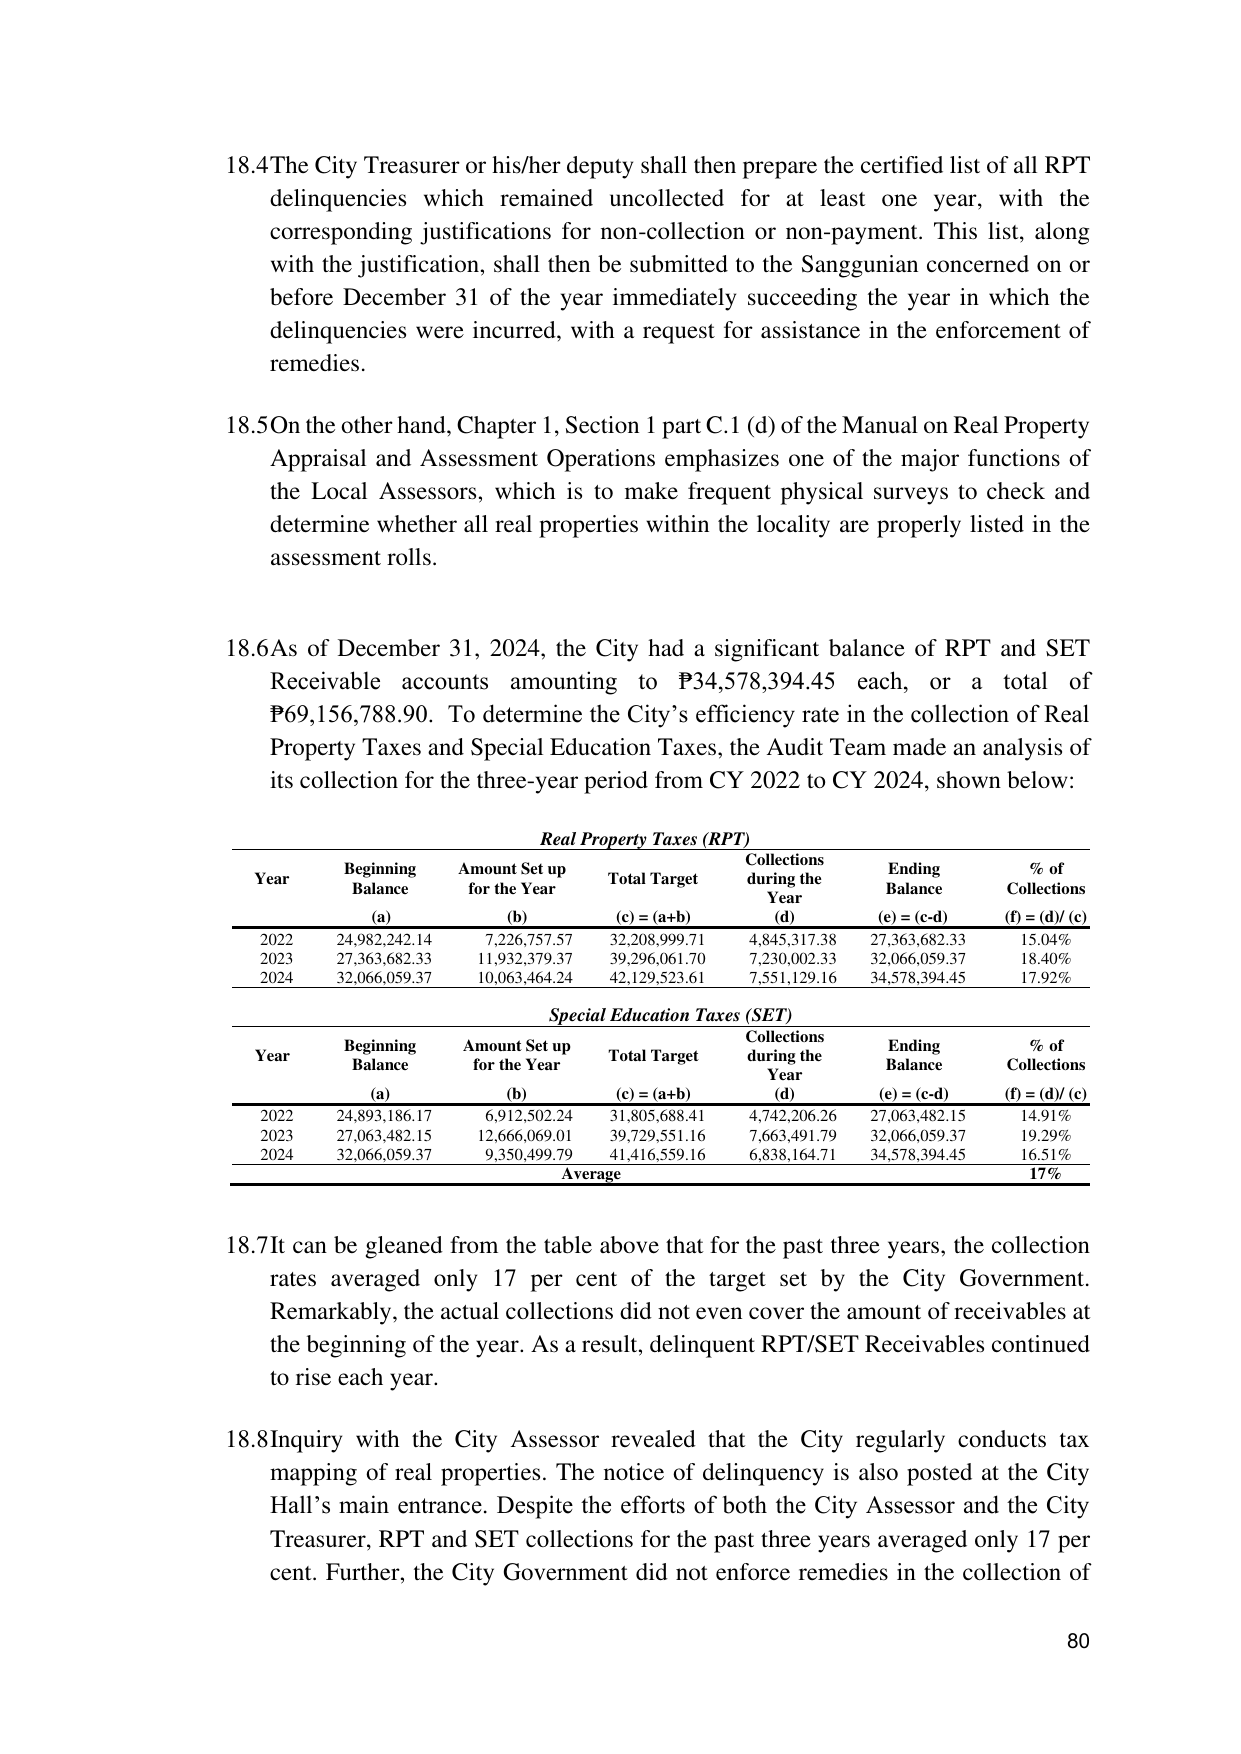
18.6 As of December 31, 2024, the City had a significant balance of RPT and SET
     Receivable accounts amounting to ₱34,578,394.45 each, or a total of
     ₱69,156,788.90. To determine the City’s efficiency rate in the collection of Real
     Property Taxes and Special Education Taxes, the Audit Team made an analysis of
     its collection for the three-year period from CY 2022 to CY 2024, shown below:

                                     Real Property Taxes (RPT)
                                                               Collections
            Beginning      Amount Set up                                        Ending          % of
   Year                                       Total Target     during the
             Balance        for the Year                                        Balance       Collections
                                                                  Year
                (a)              (b)            (c) = (a+b)        (d)         (e) = (c-d)    (f) = (d)/ (c)
   2022    24,982,242.14      7,226,757.57     32,208,999.71   4,845,317.38   27,363,682.33      15.04%
   2023    27,363,682.33     11,932,379.37     39,296,061.70   7,230,002.33   32,066,059.37      18.40%
   2024    32,066,059.37     10,063,464.24     42,129,523.61   7,551,129.16   34,578,394.45      17.92%

                                      Special Education Taxes (SET)
                                                               Collections
            Beginning      Amount Set up                                        Ending          % of
   Year                                       Total Target     during the
             Balance        for the Year                                        Balance       Collections
                                                                  Year
                (a)              (b)            (c) = (a+b)        (d)         (e) = (c-d)    (f) = (d)/ (c)
   2022    24,893,186.17      6,912,502.24     31,805,688.41   4,742,206.26   27,063,482.15      14.91%
   2023    27,063,482.15     12,666,069.01     39,729,551.16   7,663,491.79   32,066,059.37      19.29%
   2024    32,066,059.37      9,350,499.79     41,416,559.16   6,838,164.71   34,578,394.45      16.51%
                                         Average                                                  17%


18.7 It can be gleaned from the table above that for the past three years, the collection
     rates averaged only 17 per cent of the target set by the City Government.
     Remarkably, the actual collections did not even cover the amount of receivables at
     the beginning of the year. As a result, delinquent RPT/SET Receivables continued
     to rise each year.

18.8 Inquiry with the City Assessor revealed that the City regularly conducts tax
     mapping of real properties. The notice of delinquency is also posted at the City
     Hall’s main entrance. Despite the efforts of both the City Assessor and the City
     Treasurer, RPT and SET collections for the past three years averaged only 17 per
     cent. Further, the City Government did not enforce remedies in the collection of

                                                                                                        80